Quick Links
- Executive Summary
- Preamble & Section 1
-
Appropriations Recommendation
- Judiciary
- Independents
- Administration and Finance
- Energy & Environmental Affairs
-
Health and Human Services
- Health & Human Services
- Elder Affairs
- Public Health
- Mental Health
- Refugees and Immigrants
- Youth Services
- Transitional Assistance
- Children and Families
- Mass Commission for the Blind
- Mass Rehabilitation Commission
- Mass Commission for the Deaf
- Developmental Services
- Veterans' Services
- Soldiers' Home, Chelsea
- Soldiers' Home, Holyoke
- Transportation
- Housing & Economic Development
- Labor & Workforce Development
- Education
- Public Safety
- Legislature
- Line Item Summary
- Local Aid to Cities and Towns
- Outside Sections
- Financial Statements
- Operating Transfers
- Tax Expenditure Budget
- Downloads
- Related Legislation
Department of Public Health
| SPENDING CATEGORY |
FY2014
Expended |
FY2015
Expended |
FY2016
Expended |
FY2017
Projected Spending |
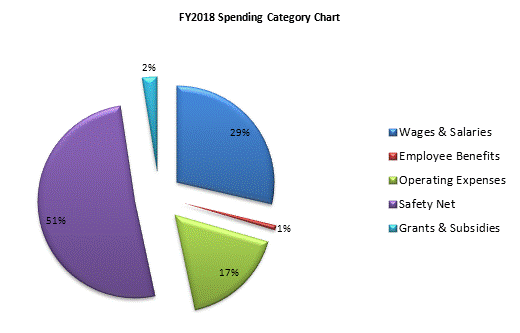
FY2018
House 1 |
|---|---|---|---|---|---|
| Wages & Salaries | 159,369 | 166,994 | 158,064 | 166,984 | 173,544 |
| Employee Benefits | 4,374 | 4,663 | 4,724 | 4,886 | 4,931 |
| Operating Expenses | 128,527 | 88,770 | 89,503 | 98,772 | 104,235 |
| Safety Net | 237,610 | 239,746 | 260,793 | 313,695 | 308,954 |
| Grants & Subsidies | 16,912 | 16,719 | 17,875 | 14,728 | 14,405 |
| TOTAL | 546,793 | 516,892 | 530,959 | 599,066 | 606,068 |

 top of page