Quick Links
- Executive Summary
- Preamble & Section 1
- Appropriations Recommendation
- Line Item Summary
- Local Aid to Cities and Towns
- Outside Sections
- Financial Statements
- Operating Transfers
- Tax Expenditure Budget
- Downloads
- Related Legislation
Executive Office of Education
| SPENDING CATEGORY |
FY2014
Expended |
FY2015
Expended |
FY2016
Expended |
FY2017
Projected Spending |
FY2018
House 1 |
|---|---|---|---|---|---|
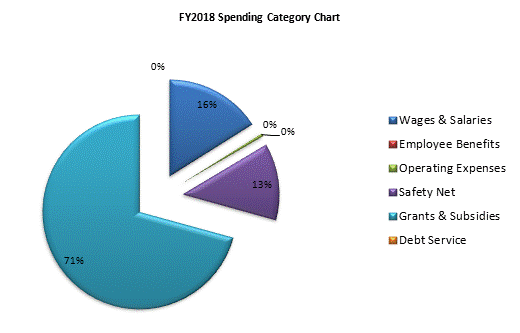
| Wages & Salaries | 1,031,083 | 1,110,835 | 1,136,134 | 1,123,864 | 1,129,176 |
| Employee Benefits | 13,773 | 15,332 | 15,306 | 7,063 | 7,070 |
| Operating Expenses | 30,687 | 38,785 | 36,923 | 31,154 | 32,334 |
| Safety Net | 809,736 | 843,347 | 869,334 | 880,720 | 897,536 |
| Grants & Subsidies | 4,625,776 | 4,687,427 | 4,817,519 | 4,911,340 | 4,997,081 |
| Debt Service | 0 | 232 | 232 | 500 | 250 |
| TOTAL | 6,511,055 | 6,695,959 | 6,875,449 | 6,954,641 | 7,063,448 |

 top of page