Quick Links
- Executive Summary
- Preamble & Section 1
- Appropriations Recommendation
- Line Item Summary
- Local Aid to Cities and Towns
- Outside Sections
- Financial Statements
- Operating Transfers
- Tax Expenditure Budget
- Downloads
- Related Legislation
Executive Office of Labor and Workforce Development
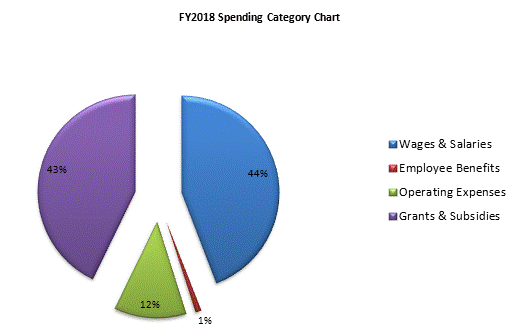
| SPENDING CATEGORY |
FY2014
Expended |
FY2015
Expended |
FY2016
Expended |
FY2017
Projected Spending |
FY2018
House 1 |
|---|---|---|---|---|---|
| Wages & Salaries | 18,794 | 19,262 | 19,352 | 19,707 | 21,005 |
| Employee Benefits | 385 | 359 | 511 | 418 | 446 |
| Operating Expenses | 4,346 | 4,040 | 4,481 | 4,966 | 5,708 |
| Grants & Subsidies | 19,108 | 18,645 | 20,816 | 19,390 | 20,341 |
| TOTAL | 42,633 | 42,306 | 45,160 | 44,481 | 47,500 |
 top of page