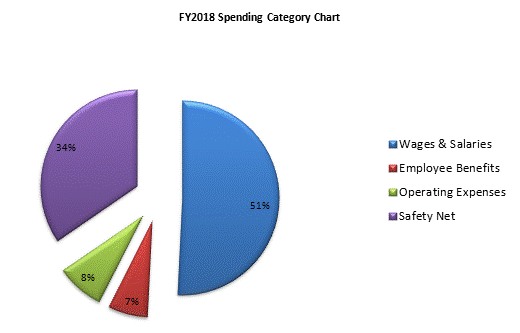
Legislature
| SPENDING CATEGORY |
FY2014
Expended |
FY2015
Expended |
FY2016
Expended |
FY2017
Projected Spending |
FY2018
House 1 |
|---|---|---|---|---|---|
| Wages & Salaries | 50,038 | 50,558 | 53,159 | 34,630 | 35,133 |
| Employee Benefits | 1,259 | 1,358 | 1,385 | 4,599 | 4,596 |
| Operating Expenses | 5,207 | 8,577 | 6,961 | 6,032 | 5,532 |
| Safety Net | 0 | 0 | 0 | 23,921 | 23,921 |
| Debt Service | 0 | 0 | 0 | 29,942 | 0 |
| TOTAL | 56,504 | 60,493 | 61,505 | 99,124 | 69,182 |

 top of page