Quick Links
- Executive Summary
- Preamble & Section 1
- Appropriations Recommendation
- Line Item Summary
- Local Aid to Cities and Towns
- Outside Sections
- Financial Statements
- Operating Transfers
- Tax Expenditure Budget
- Downloads
- Related Legislation
Judiciary
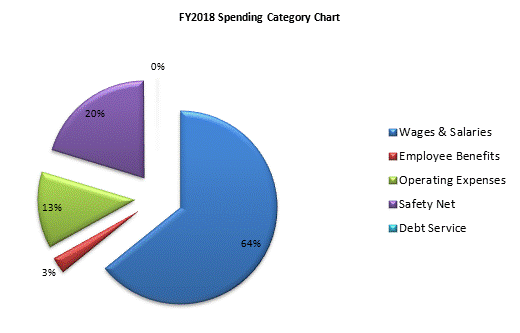
| SPENDING CATEGORY |
FY2014
Expended |
FY2015
Expended |
FY2016
Expended |
FY2017
Projected Spending |
FY2018
House 1 |
|---|---|---|---|---|---|
| Wages & Salaries | 533,386 | 556,006 | 569,163 | 587,363 | 592,030 |
| Employee Benefits | 21,343 | 23,553 | 24,442 | 25,092 | 25,309 |
| Operating Expenses | 104,671 | 105,515 | 121,492 | 114,475 | 117,669 |
| Safety Net | 160,909 | 161,564 | 170,784 | 191,553 | 186,611 |
| Debt Service | 657 | 657 | 766 | 766 | 766 |
| TOTAL | 820,965 | 847,294 | 886,647 | 919,248 | 922,384 |

 top of page