Quick Links
- Executive Summary
- Preamble & Section 1
- Appropriations Recommendation
- Line Item Summary
- Local Aid to Cities and Towns
- Outside Sections
- Financial Statements
- Operating Transfers
- Tax Expenditure Budget
- Downloads
- Related Legislation
Trial Court
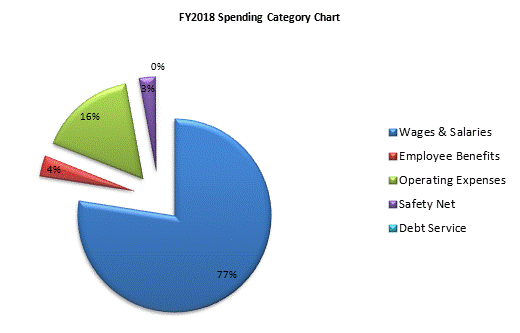
| SPENDING CATEGORY |
FY2014
Expended |
FY2015
Expended |
FY2016
Expended |
FY2017
Projected Spending |
FY2018
House 1 |
|---|---|---|---|---|---|
| Wages & Salaries | 457,153 | 475,363 | 484,432 | 496,773 | 501,110 |
| Employee Benefits | 19,566 | 21,500 | 22,150 | 22,626 | 22,740 |
| Operating Expenses | 91,341 | 92,018 | 106,951 | 101,430 | 104,283 |
| Safety Net | 10,979 | 11,987 | 12,025 | 17,816 | 17,907 |
| Debt Service | 657 | 657 | 766 | 766 | 766 |
| TOTAL | 579,696 | 601,526 | 626,324 | 639,411 | 646,805 |
 top of page