Quick Links
- Executive Summary
- Preamble & Section 1
- Appropriations Recommendation
- Line Item Summary
- Local Aid to Cities and Towns
- Outside Sections
- Financial Statements
- Operating Transfers
- Tax Expenditure Budget
- Downloads
- Related Legislation
Committee for Public Counsel Services
| SPENDING CATEGORY |
FY2014
Expended |
FY2015
Expended |
FY2016
Expended |
FY2017
Projected Spending |
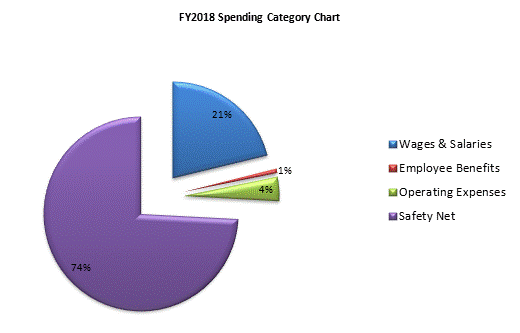
FY2018
House 1 |
|---|---|---|---|---|---|
| Wages & Salaries | 41,536 | 42,946 | 44,149 | 47,992 | 48,207 |
| Employee Benefits | 1,181 | 1,350 | 1,545 | 1,638 | 1,635 |
| Operating Expenses | 9,173 | 9,191 | 10,008 | 8,908 | 8,908 |
| Safety Net | 149,930 | 149,577 | 158,759 | 173,737 | 168,704 |
| TOTAL | 201,820 | 203,063 | 214,461 | 232,274 | 227,454 |

 top of page