Quick Links
- Executive Summary
- Preamble & Section 1
- Appropriations Recommendation
- Line Item Summary
- Local Aid to Cities and Towns
- Outside Sections
- Financial Statements
- Operating Transfers
- Tax Expenditure Budget
- Downloads
- Related Legislation
Public Safety and Security
| SPENDING CATEGORY |
FY2014
Expended |
FY2015
Expended |
FY2016
Expended |
FY2017
Projected Spending |
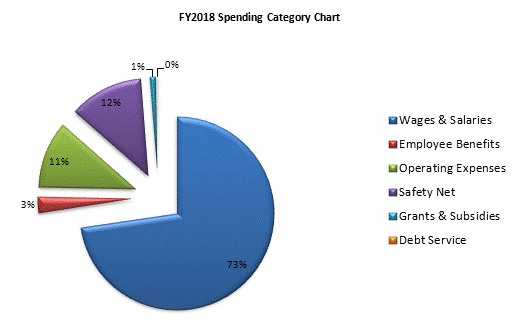
FY2018
House 1 |
|---|---|---|---|---|---|
| Wages & Salaries | 728,848 | 758,084 | 765,890 | 782,030 | 808,680 |
| Employee Benefits | 24,234 | 27,212 | 28,544 | 29,520 | 29,294 |
| Operating Expenses | 126,965 | 126,985 | 126,476 | 120,854 | 124,175 |
| Safety Net | 108,148 | 108,134 | 118,668 | 133,054 | 137,175 |
| Grants & Subsidies | 16,129 | 14,074 | 20,261 | 17,144 | 10,829 |
| Debt Service | 953 | 731 | 2,062 | 2,724 | 2,724 |
| TOTAL | 1,005,277 | 1,035,220 | 1,061,900 | 1,085,325 | 1,112,876 |

 top of page