Quick Links
- Executive Summary
- Preamble & Section 1
- Appropriations Recommendation
- Line Item Summary
- Local Aid to Cities and Towns
- Outside Sections
- Financial Statements
- Operating Transfers
- Tax Expenditure Budget
- Downloads
- Related Legislation
Military Division
| SPENDING CATEGORY |
FY2014
Expended |
FY2015
Expended |
FY2016
Expended |
FY2017
Projected Spending |
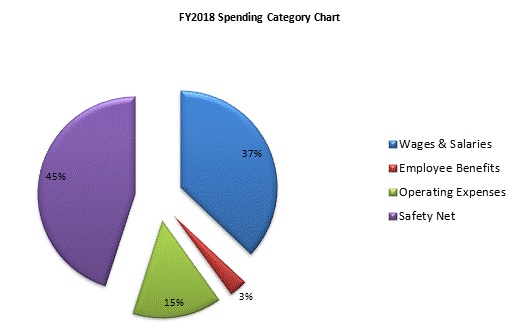
FY2018
House 1 |
|---|---|---|---|---|---|
| Wages & Salaries | 7,368 | 7,993 | 6,761 | 7,025 | 7,221 |
| Employee Benefits | 494 | 573 | 540 | 546 | 586 |
| Operating Expenses | 2,257 | 3,394 | 2,372 | 2,895 | 2,894 |
| Safety Net | 7,228 | 4,570 | 15,558 | 8,659 | 8,777 |
| Grants & Subsidies | 0 | 0 | 300 | 50 | 0 |
| TOTAL | 17,346 | 16,530 | 25,531 | 19,175 | 19,478 |

 top of page