Quick Links
- Executive Summary
- Preamble & Section 1
- Appropriations Recommendation
- Line Item Summary
- Local Aid to Cities and Towns
- Outside Sections
- Financial Statements
- Operating Transfers
- Tax Expenditure Budget
- Downloads
- Related Legislation
Office of the Chief Medical Examiner
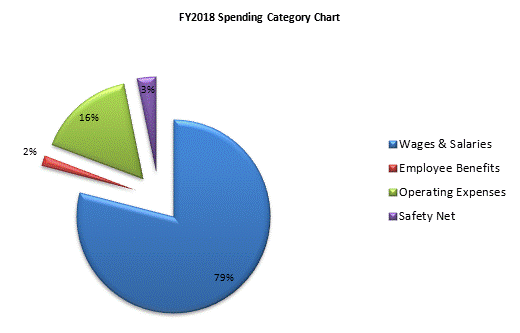
| SPENDING CATEGORY |
FY2014
Expended |
FY2015
Expended |
FY2016
Expended |
FY2017
Projected Spending |
FY2018
House 1 |
|---|---|---|---|---|---|
| Wages & Salaries | 7,480 | 8,539 | 9,004 | 10,051 | 10,271 |
| Employee Benefits | 149 | 205 | 184 | 223 | 225 |
| Operating Expenses | 1,991 | 2,129 | 2,178 | 1,933 | 2,092 |
| Safety Net | 0 | 0 | 0 | 412 | 412 |
| TOTAL | 9,621 | 10,874 | 11,367 | 12,619 | 13,000 |
 top of page