Quick Links
- Executive Summary
- Preamble & Section 1
-
Appropriations Recommendation
- Judiciary
- Independents
-
Administration and Finance
- Administration & Finance
- Dev. Disabilities Council
- Capital Asset Management
- Bureau of the State House
- Office on Disability
- Teachers' Retirement Board
- Group Insurance
- Public Employee Retirement
- Administrative Law Appeals
- George Fingold Library
- Dept. of Revenue
- Appellate Tax Board
- Health Policy Commission
- Human Resources Division
- Civil Service Commission
- Operational Services Division
- Mass IT
- Energy & Environmental Affairs
- Health and Human Services
- Transportation
- Housing & Economic Development
- Labor & Workforce Development
- Education
- Public Safety
- Legislature
- Line Item Summary
- Local Aid to Cities and Towns
- Outside Sections
- Financial Statements
- Operating Transfers
- Tax Expenditure Budget
- Downloads
- Related Legislation
Administration and Finance
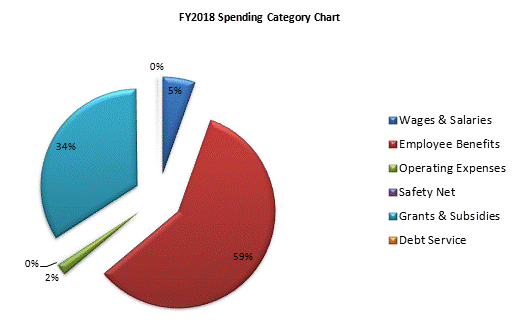
| SPENDING CATEGORY |
FY2014
Expended |
FY2015
Expended |
FY2016
Expended |
FY2017
Projected Spending |
FY2018
House 1 |
|---|---|---|---|---|---|
| Wages & Salaries | 194,319 | 192,202 | 169,759 | 191,666 | 203,603 |
| Employee Benefits | 1,848,776 | 2,094,361 | 2,109,352 | 2,166,540 | 2,195,854 |
| Operating Expenses | 70,421 | 62,037 | 56,932 | 91,156 | 70,565 |
| Safety Net | 352,612 | 14,757 | 10,070 | 19,500 | 6,000 |
| Grants & Subsidies | 1,112,798 | 1,136,747 | 1,174,843 | 1,216,151 | 1,273,053 |
| Debt Service | 87 | 49 | 2,586 | 2,769 | 7,385 |
| TOTAL | 3,579,013 | 3,500,153 | 3,523,542 | 3,687,782 | 3,756,461 |
 top of page