Quick Links
- Executive Summary
- Preamble & Section 1
-
Appropriations Recommendation
- Judiciary
- Independents
-
Administration and Finance
- Administration & Finance
- Dev. Disabilities Council
- Capital Asset Management
- Bureau of the State House
- Office on Disability
- Teachers' Retirement Board
- Group Insurance
- Public Employee Retirement
- Administrative Law Appeals
- George Fingold Library
- Dept. of Revenue
- Appellate Tax Board
- Health Policy Commission
- Human Resources Division
- Civil Service Commission
- Operational Services Division
- Mass IT
- Energy & Environmental Affairs
- Health and Human Services
- Transportation
- Housing & Economic Development
- Labor & Workforce Development
- Education
- Public Safety
- Legislature
- Line Item Summary
- Local Aid to Cities and Towns
- Outside Sections
- Financial Statements
- Operating Transfers
- Tax Expenditure Budget
- Downloads
- Related Legislation
Operational Services Division
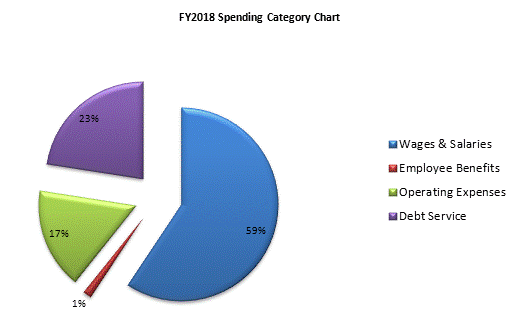
| SPENDING CATEGORY |
FY2014
Expended |
FY2015
Expended |
FY2016
Expended |
FY2017
Projected Spending |
FY2018
House 1 |
|---|---|---|---|---|---|
| Wages & Salaries | 4,812 | 6,127 | 5,940 | 7,011 | 6,979 |
| Employee Benefits | 78 | 124 | 122 | 168 | 169 |
| Operating Expenses | 1,981 | 2,284 | 1,630 | 2,224 | 1,965 |
| Debt Service | 0 | 0 | 2,552 | 2,652 | 2,652 |
| TOTAL | 6,871 | 8,535 | 10,244 | 12,056 | 11,766 |

 top of page