Quick Links
- Executive Summary
- Preamble & Section 1
-
Appropriations Recommendation
- Judiciary
- Independents
-
Administration and Finance
- Administration & Finance
- Dev. Disabilities Council
- Capital Asset Management
- Bureau of the State House
- Office on Disability
- Teachers' Retirement Board
- Group Insurance
- Public Employee Retirement
- Administrative Law Appeals
- George Fingold Library
- Dept. of Revenue
- Appellate Tax Board
- Health Policy Commission
- Human Resources Division
- Civil Service Commission
- Operational Services Division
- Mass IT
- Energy & Environmental Affairs
- Health and Human Services
- Transportation
- Housing & Economic Development
- Labor & Workforce Development
- Education
- Public Safety
- Legislature
- Line Item Summary
- Local Aid to Cities and Towns
- Outside Sections
- Financial Statements
- Operating Transfers
- Tax Expenditure Budget
- Downloads
- Related Legislation
Bureau of the State House
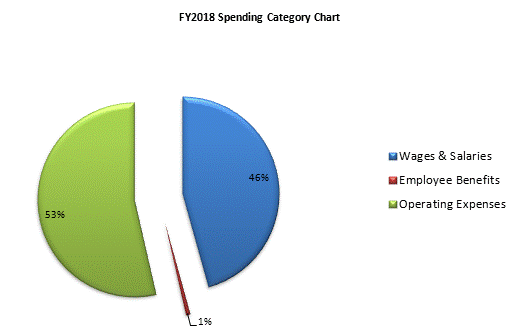
| SPENDING CATEGORY |
FY2014
Expended |
FY2015
Expended |
FY2016
Expended |
FY2017
Projected Spending |
FY2018
House 1 |
|---|---|---|---|---|---|
| Wages & Salaries | 834 | 945 | 849 | 1,075 | 1,236 |
| Employee Benefits | 12 | 15 | 14 | 20 | 20 |
| Operating Expenses | 1,434 | 1,295 | 1,514 | 1,451 | 1,451 |
| TOTAL | 2,280 | 2,255 | 2,378 | 2,546 | 2,707 |

 top of page