Quick Links
- Executive Summary
- Preamble & Section 1
- Appropriations Recommendation
- Line Item Summary
- Local Aid to Cities and Towns
- Outside Sections
- Financial Statements
- Operating Transfers
- Tax Expenditure Budget
- Downloads
- Related Legislation
Executive Office of Labor and Workforce Development
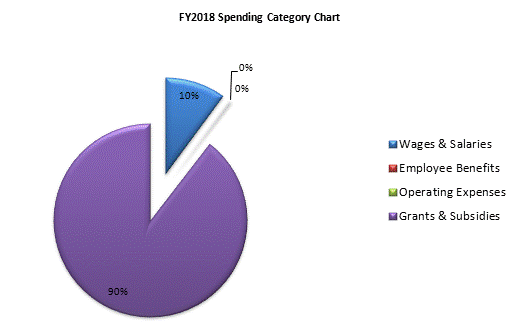
| SPENDING CATEGORY |
FY2014
Expended |
FY2015
Expended |
FY2016
Expended |
FY2017
Projected Spending |
FY2018
House 1 |
|---|---|---|---|---|---|
| Wages & Salaries | 904 | 844 | 878 | 694 | 708 |
| Employee Benefits | 14 | 13 | 15 | 13 | 13 |
| Operating Expenses | 163 | 85 | 114 | 16 | 16 |
| Grants & Subsidies | 4,075 | 3,921 | 6,200 | 4,100 | 6,300 |
| TOTAL | 5,156 | 4,865 | 7,207 | 4,822 | 7,037 |
 top of page