Quick Links
- Executive Summary
- Preamble & Section 1
- Appropriations Recommendation
- Line Item Summary
- Local Aid to Cities and Towns
- Outside Sections
- Financial Statements
- Operating Transfers
- Tax Expenditure Budget
- Downloads
- Related Legislation
Department of Higher Education
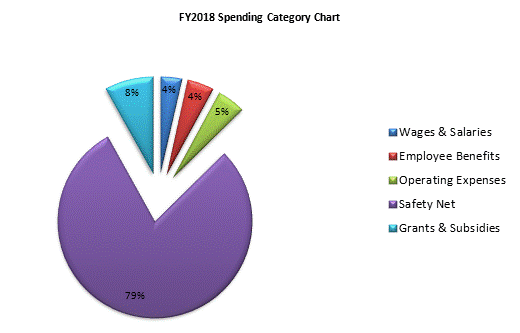
| SPENDING CATEGORY |
FY2014
Expended |
FY2015
Expended |
FY2016
Expended |
FY2017
Projected Spending |
FY2018
House 1 |
|---|---|---|---|---|---|
| Wages & Salaries | 8,513 | 7,803 | 5,708 | 4,915 | 4,358 |
| Employee Benefits | 5,693 | 5,684 | 5,625 | 5,626 | 5,620 |
| Operating Expenses | 6,120 | 5,563 | 6,074 | 5,854 | 5,913 |
| Safety Net | 95,656 | 98,176 | 100,176 | 101,277 | 100,177 |
| Grants & Subsidies | 7,725 | 5,545 | 7,993 | 11,207 | 10,139 |
| TOTAL | 123,707 | 122,771 | 125,577 | 128,879 | 126,207 |
 top of page