Quick Links
- Executive Summary
- Preamble & Section 1
-
Appropriations Recommendation
- Judiciary
- Independents
- Administration and Finance
- Energy & Environmental Affairs
-
Health and Human Services
- Health & Human Services
- Elder Affairs
- Public Health
- Mental Health
- Refugees and Immigrants
- Youth Services
- Transitional Assistance
- Children and Families
- Mass Commission for the Blind
- Mass Rehabilitation Commission
- Mass Commission for the Deaf
- Developmental Services
- Veterans' Services
- Soldiers' Home, Chelsea
- Soldiers' Home, Holyoke
- Transportation
- Housing & Economic Development
- Labor & Workforce Development
- Education
- Public Safety
- Legislature
- Line Item Summary
- Local Aid to Cities and Towns
- Outside Sections
- Financial Statements
- Operating Transfers
- Tax Expenditure Budget
- Downloads
- Related Legislation
Department of Veterans' Services
| SPENDING CATEGORY |
FY2014
Expended |
FY2015
Expended |
FY2016
Expended |
FY2017
Projected Spending |
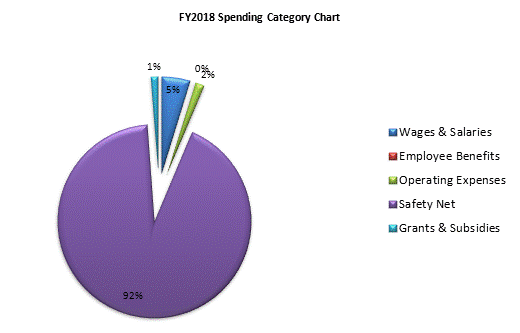
FY2018
House 1 |
|---|---|---|---|---|---|
| Wages & Salaries | 3,413 | 3,342 | 3,420 | 4,277 | 4,390 |
| Employee Benefits | 67 | 106 | 87 | 148 | 108 |
| Operating Expenses | 819 | 1,403 | 1,264 | 1,386 | 1,413 |
| Safety Net | 78,477 | 82,243 | 84,156 | 84,573 | 86,011 |
| Grants & Subsidies | 717 | 866 | 1,177 | 1,128 | 1,078 |
| TOTAL | 83,493 | 87,961 | 90,104 | 91,511 | 93,000 |

 top of page