Quick Links
- Executive Summary
- Preamble & Section 1
-
Appropriations Recommendation
- Judiciary
- Independents
- Administration and Finance
- Energy & Environmental Affairs
-
Health and Human Services
- Health & Human Services
- Elder Affairs
- Public Health
- Mental Health
- Refugees and Immigrants
- Youth Services
- Transitional Assistance
- Children and Families
- Mass Commission for the Blind
- Mass Rehabilitation Commission
- Mass Commission for the Deaf
- Developmental Services
- Veterans' Services
- Soldiers' Home, Chelsea
- Soldiers' Home, Holyoke
- Transportation
- Housing & Economic Development
- Labor & Workforce Development
- Education
- Public Safety
- Legislature
- Line Item Summary
- Local Aid to Cities and Towns
- Outside Sections
- Financial Statements
- Operating Transfers
- Tax Expenditure Budget
- Downloads
- Related Legislation
Office for Refugees and Immigrants
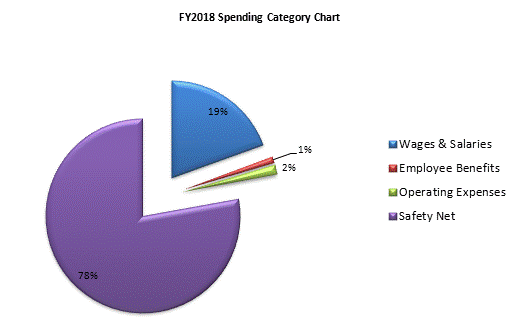
| SPENDING CATEGORY |
FY2014
Expended |
FY2015
Expended |
FY2016
Expended |
FY2017
Projected Spending |
FY2018
House 1 |
|---|---|---|---|---|---|
| Wages & Salaries | 39 | 66 | 66 | 78 | 78 |
| Employee Benefits | 1 | 1 | 2 | 4 | 4 |
| Operating Expenses | 0 | 5 | 5 | 6 | 6 |
| Safety Net | 291 | 288 | 308 | 307 | 311 |
| TOTAL | 331 | 361 | 381 | 396 | 400 |
 top of page