Quick Links
- Executive Summary
- Preamble & Section 1
-
Appropriations Recommendation
- Judiciary
- Independents
- Administration and Finance
- Energy & Environmental Affairs
-
Health and Human Services
- Health & Human Services
- Elder Affairs
- Public Health
- Mental Health
- Refugees and Immigrants
- Youth Services
- Transitional Assistance
- Children and Families
- Mass Commission for the Blind
- Mass Rehabilitation Commission
- Mass Commission for the Deaf
- Developmental Services
- Veterans' Services
- Soldiers' Home, Chelsea
- Soldiers' Home, Holyoke
- Transportation
- Housing & Economic Development
- Labor & Workforce Development
- Education
- Public Safety
- Legislature
- Line Item Summary
- Local Aid to Cities and Towns
- Outside Sections
- Financial Statements
- Operating Transfers
- Tax Expenditure Budget
- Downloads
- Related Legislation
Department of Children and Families
| SPENDING CATEGORY |
FY2014
Expended |
FY2015
Expended |
FY2016
Expended |
FY2017
Projected Spending |
FY2018
House 1 |
|---|---|---|---|---|---|
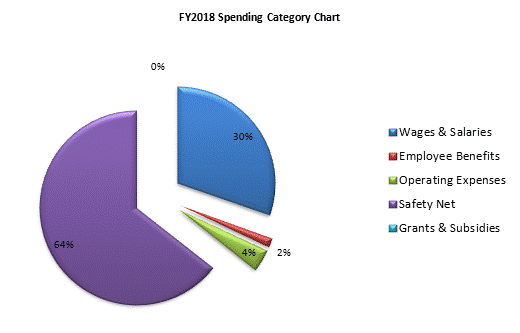
| Wages & Salaries | 216,800 | 238,231 | 248,336 | 284,912 | 299,081 |
| Employee Benefits | 8,862 | 11,151 | 11,818 | 14,298 | 14,675 |
| Operating Expenses | 24,650 | 26,975 | 29,215 | 34,323 | 36,811 |
| Safety Net | 538,322 | 589,100 | 620,763 | 625,069 | 635,018 |
| Grants & Subsidies | 25 | 25 | 25 | 50 | 13 |
| TOTAL | 788,658 | 865,481 | 910,157 | 958,651 | 985,598 |

 top of page