Quick Links
- Executive Summary
- Preamble & Section 1
-
Appropriations Recommendation
- Judiciary
- Independents
- Administration and Finance
- Energy & Environmental Affairs
-
Health and Human Services
- Health & Human Services
- Elder Affairs
- Public Health
- Mental Health
- Refugees and Immigrants
- Youth Services
- Transitional Assistance
- Children and Families
- Mass Commission for the Blind
- Mass Rehabilitation Commission
- Mass Commission for the Deaf
- Developmental Services
- Veterans' Services
- Soldiers' Home, Chelsea
- Soldiers' Home, Holyoke
- Transportation
- Housing & Economic Development
- Labor & Workforce Development
- Education
- Public Safety
- Legislature
- Line Item Summary
- Local Aid to Cities and Towns
- Outside Sections
- Financial Statements
- Operating Transfers
- Tax Expenditure Budget
- Downloads
- Related Legislation
Department of Mental Health
| SPENDING CATEGORY |
FY2014
Expended |
FY2015
Expended |
FY2016
Expended |
FY2017
Projected Spending |
FY2018
House 1 |
|---|---|---|---|---|---|
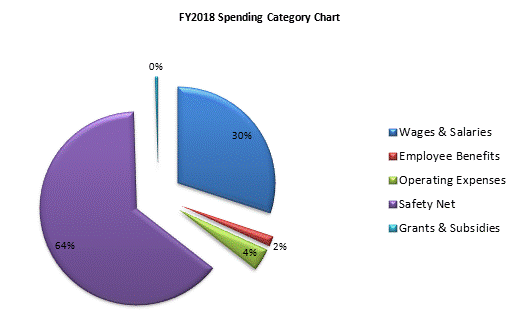
| Wages & Salaries | 201,734 | 214,408 | 214,807 | 237,213 | 232,403 |
| Employee Benefits | 9,479 | 10,761 | 12,181 | 13,098 | 13,349 |
| Operating Expenses | 23,461 | 23,549 | 25,968 | 28,924 | 29,157 |
| Safety Net | 447,408 | 446,501 | 468,066 | 486,911 | 494,593 |
| Grants & Subsidies | 799 | 903 | 1,131 | 1,622 | 3,697 |
| TOTAL | 682,881 | 696,122 | 722,152 | 767,769 | 773,199 |

 top of page