Quick Links
- Executive Summary
- Preamble & Section 1
-
Appropriations Recommendation
- Judiciary
- Independents
- Administration and Finance
- Energy & Environmental Affairs
-
Health and Human Services
- Health & Human Services
- Elder Affairs
- Public Health
- Mental Health
- Refugees and Immigrants
- Youth Services
- Transitional Assistance
- Children and Families
- Mass Commission for the Blind
- Mass Rehabilitation Commission
- Mass Commission for the Deaf
- Developmental Services
- Veterans' Services
- Soldiers' Home, Chelsea
- Soldiers' Home, Holyoke
- Transportation
- Housing & Economic Development
- Labor & Workforce Development
- Education
- Public Safety
- Legislature
- Line Item Summary
- Local Aid to Cities and Towns
- Outside Sections
- Financial Statements
- Operating Transfers
- Tax Expenditure Budget
- Downloads
- Related Legislation
5920-2010 - State Operated Residential Services
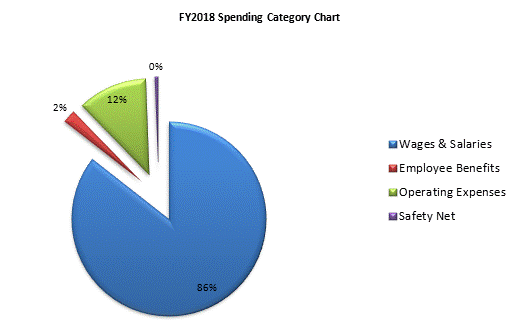
| SPENDING CATEGORY |
FY2014
Expended |
FY2015
Expended |
FY2016
Expended |
FY2017
Projected Spending |
FY2018
House 1 |
|---|---|---|---|---|---|
| Wages & Salaries | 165,941 | 179,748 | 182,784 | 187,763 | 185,388 |
| Employee Benefits | 4,072 | 4,342 | 4,587 | 4,672 | 4,729 |
| Operating Expenses | 22,340 | 24,026 | 22,699 | 25,023 | 25,246 |
| Safety Net | 645 | 730 | 1,088 | 1,249 | 1,249 |
| TOTAL | 192,998 | 208,846 | 211,158 | 218,708 | 216,612 |

 top of page