Quick Links
- Executive Summary
- Preamble & Section 1
-
Appropriations Recommendation
- Judiciary
- Independents
- Administration and Finance
- Energy & Environmental Affairs
-
Health and Human Services
- Health & Human Services
- Elder Affairs
- Public Health
- Mental Health
- Refugees and Immigrants
- Youth Services
- Transitional Assistance
- Children and Families
- Mass Commission for the Blind
- Mass Rehabilitation Commission
- Mass Commission for the Deaf
- Developmental Services
- Veterans' Services
- Soldiers' Home, Chelsea
- Soldiers' Home, Holyoke
- Transportation
- Housing & Economic Development
- Labor & Workforce Development
- Education
- Public Safety
- Legislature
- Line Item Summary
- Local Aid to Cities and Towns
- Outside Sections
- Financial Statements
- Operating Transfers
- Tax Expenditure Budget
- Downloads
- Related Legislation
5046-0000 - Adult Mental Health and Support Services
| SPENDING CATEGORY |
FY2014
Expended |
FY2015
Expended |
FY2016
Expended |
FY2017
Projected Spending |
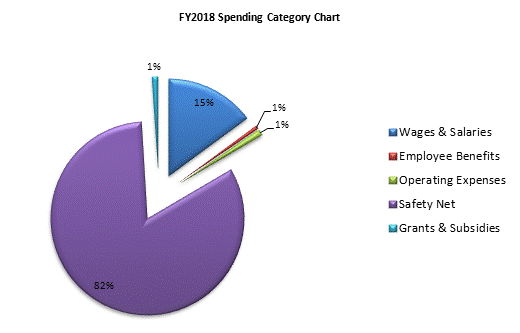
FY2018
House 1 |
|---|---|---|---|---|---|
| Wages & Salaries | 54,608 | 57,132 | 55,941 | 59,653 | 57,714 |
| Employee Benefits | 1,921 | 2,034 | 2,055 | 2,321 | 2,331 |
| Operating Expenses | 3,575 | 3,268 | 3,310 | 4,079 | 4,118 |
| Safety Net | 290,376 | 284,056 | 311,527 | 313,349 | 319,772 |
| Grants & Subsidies | 799 | 903 | 1,131 | 1,622 | 3,697 |
| TOTAL | 351,279 | 347,393 | 373,964 | 381,023 | 387,631 |

 top of page