Quick Links
- Executive Summary
- Preamble & Section 1
-
Appropriations Recommendation
- Judiciary
- Independents
- Administration and Finance
- Energy & Environmental Affairs
-
Health and Human Services
- Health & Human Services
- Elder Affairs
- Public Health
- Mental Health
- Refugees and Immigrants
- Youth Services
- Transitional Assistance
- Children and Families
- Mass Commission for the Blind
- Mass Rehabilitation Commission
- Mass Commission for the Deaf
- Developmental Services
- Veterans' Services
- Soldiers' Home, Chelsea
- Soldiers' Home, Holyoke
- Transportation
- Housing & Economic Development
- Labor & Workforce Development
- Education
- Public Safety
- Legislature
- Line Item Summary
- Local Aid to Cities and Towns
- Outside Sections
- Financial Statements
- Operating Transfers
- Tax Expenditure Budget
- Downloads
- Related Legislation
4590-0915 - Public Health Hospitals
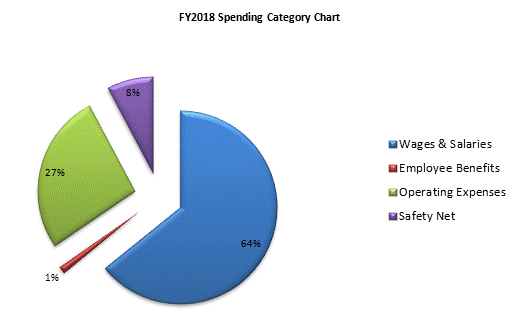
| SPENDING CATEGORY |
FY2014
Expended |
FY2015
Expended |
FY2016
Expended |
FY2017
Projected Spending |
FY2018
House 1 |
|---|---|---|---|---|---|
| Wages & Salaries | 94,903 | 98,070 | 95,017 | 99,895 | 100,709 |
| Employee Benefits | 1,592 | 1,804 | 1,978 | 1,934 | 1,945 |
| Operating Expenses | 36,613 | 37,901 | 38,228 | 40,197 | 42,100 |
| Safety Net | 12,075 | 12,049 | 11,813 | 12,545 | 12,166 |
| TOTAL | 145,183 | 149,824 | 147,036 | 154,570 | 156,921 |
 top of page