Quick Links
- Executive Summary
- Preamble & Section 1
-
Appropriations Recommendation
- Judiciary
- Independents
- Administration and Finance
- Energy & Environmental Affairs
-
Health and Human Services
- Health & Human Services
- Elder Affairs
- Public Health
- Mental Health
- Refugees and Immigrants
- Youth Services
- Transitional Assistance
- Children and Families
- Mass Commission for the Blind
- Mass Rehabilitation Commission
- Mass Commission for the Deaf
- Developmental Services
- Veterans' Services
- Soldiers' Home, Chelsea
- Soldiers' Home, Holyoke
- Transportation
- Housing & Economic Development
- Labor & Workforce Development
- Education
- Public Safety
- Legislature
- Line Item Summary
- Local Aid to Cities and Towns
- Outside Sections
- Financial Statements
- Operating Transfers
- Tax Expenditure Budget
- Downloads
- Related Legislation
4510-0100 - Public Health Critical Operations and Essential Services
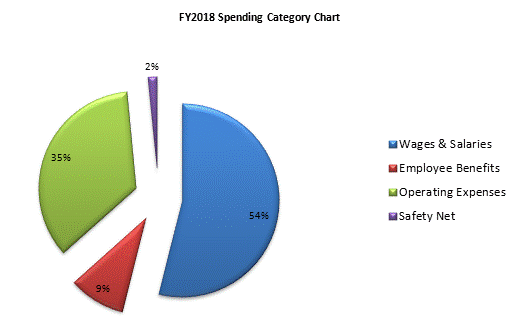
| SPENDING CATEGORY |
FY2014
Expended |
FY2015
Expended |
FY2016
Expended |
FY2017
Projected Spending |
FY2018
House 1 |
|---|---|---|---|---|---|
| Wages & Salaries | 10,600 | 11,006 | 9,328 | 9,701 | 9,556 |
| Employee Benefits | 1,765 | 1,678 | 1,629 | 1,677 | 1,678 |
| Operating Expenses | 5,187 | 5,515 | 5,783 | 6,038 | 6,216 |
| Safety Net | 690 | 367 | 367 | 283 | 267 |
| Grants & Subsidies | 153 | 153 | 153 | 153 | 0 |
| TOTAL | 18,395 | 18,720 | 17,261 | 17,852 | 17,718 |

 top of page