Quick Links
- Executive Summary
- Preamble & Section 1
-
Appropriations Recommendation
- Judiciary
- Independents
- Administration and Finance
- Energy & Environmental Affairs
-
Health and Human Services
- Health & Human Services
- Elder Affairs
- Public Health
- Mental Health
- Refugees and Immigrants
- Youth Services
- Transitional Assistance
- Children and Families
- Mass Commission for the Blind
- Mass Rehabilitation Commission
- Mass Commission for the Deaf
- Developmental Services
- Veterans' Services
- Soldiers' Home, Chelsea
- Soldiers' Home, Holyoke
- Transportation
- Housing & Economic Development
- Labor & Workforce Development
- Education
- Public Safety
- Legislature
- Line Item Summary
- Local Aid to Cities and Towns
- Outside Sections
- Financial Statements
- Operating Transfers
- Tax Expenditure Budget
- Downloads
- Related Legislation
4200-0100 - Non-Residential Services for Committed Population
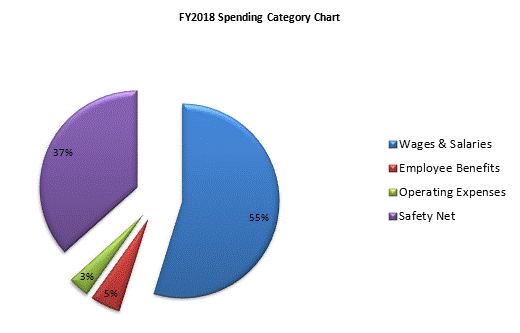
| SPENDING CATEGORY |
FY2014
Expended |
FY2015
Expended |
FY2016
Expended |
FY2017
Projected Spending |
FY2018
House 1 |
|---|---|---|---|---|---|
| Wages & Salaries | 11,515 | 11,979 | 11,984 | 12,598 | 12,973 |
| Employee Benefits | 1,165 | 1,229 | 1,250 | 1,184 | 1,188 |
| Operating Expenses | 840 | 882 | 743 | 839 | 839 |
| Safety Net | 8,383 | 7,609 | 7,894 | 8,559 | 8,680 |
| TOTAL | 21,903 | 21,698 | 21,871 | 23,180 | 23,680 |

 top of page