- Executive Summary
- Preamble & Section 1
- Appropriations Recommendation
- Line Item Summary
- Local Aid to Cities and Towns
- Outside Sections
- Financial Statements
- Operating Transfers
- Tax Expenditure Budget
- Downloads
Department of Housing and Community Development
| SPENDING CATEGORY |
FY2015 Expended |
FY2016 Expended |
FY2017 Expended |
FY2018 Projected Spending |
FY2019 House 2 |
|---|---|---|---|---|---|
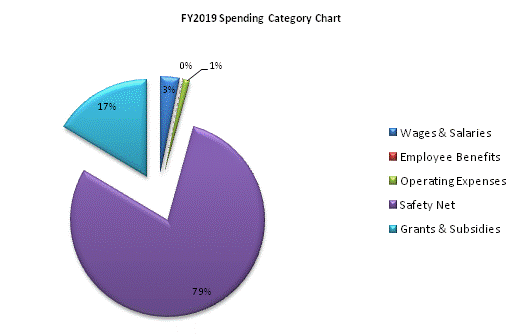
| Wages & Salaries | 17,056 | 19,357 | 13,766 | 13,375 | 13,757 |
| Employee Benefits | 367 | 371 | 377 | 366 | 370 |
| Operating Expenses | 3,932 | 3,028 | 3,302 | 4,470 | 4,941 |
| Safety Net | 337,840 | 360,746 | 353,460 | 354,378 | 353,887 |
| Grants & Subsidies | 70,406 | 72,060 | 59,508 | 68,845 | 73,286 |
| Other | 0 | 0 | 0 | 6,540 | 0 |
| TOTAL | 429,600 | 455,561 | 430,413 | 447,975 | 446,240 |

 top of page