- Executive Summary
- Preamble & Section 1
- Appropriations Recommendation
- Line Item Summary
- Local Aid to Cities and Towns
- Outside Sections
- Financial Statements
- Operating Transfers
- Tax Expenditure Budget
- Downloads
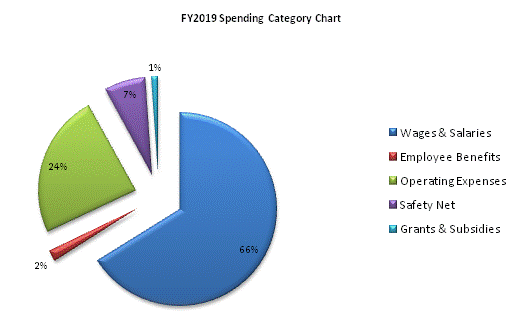
Executive Office of Energy and Environmental Affairs
| SPENDING CATEGORY |
FY2015 Expended |
FY2016 Expended |
FY2017 Expended |
FY2018 Projected Spending |
FY2019 House 2 |
|---|---|---|---|---|---|
| Wages & Salaries | 151,664 | 145,646 | 149,622 | 154,054 | 159,922 |
| Employee Benefits | 4,619 | 4,463 | 4,262 | 4,407 | 4,483 |
| Operating Expenses | 51,363 | 52,209 | 50,994 | 59,461 | 58,025 |
| Safety Net | 14,762 | 16,773 | 16,741 | 16,746 | 16,746 |
| Grants & Subsidies | 2,873 | 2,815 | 1,194 | 1,966 | 2,679 |
| Other | 0 | 0 | 0 | 5,420 | 0 |
| TOTAL | 225,282 | 221,905 | 222,813 | 242,054 | 241,854 |

 top of page