- Executive Summary
- Preamble & Section 1
- Appropriations Recommendation
- Line Item Summary
- Local Aid to Cities and Towns
- Outside Sections
- Financial Statements
- Operating Transfers
- Tax Expenditure Budget
- Downloads
Executive Office of Education
| SPENDING CATEGORY |
FY2015 Expended |
FY2016 Expended |
FY2017 Expended |
FY2018 Projected Spending |
FY2019 House 2 |
|---|---|---|---|---|---|
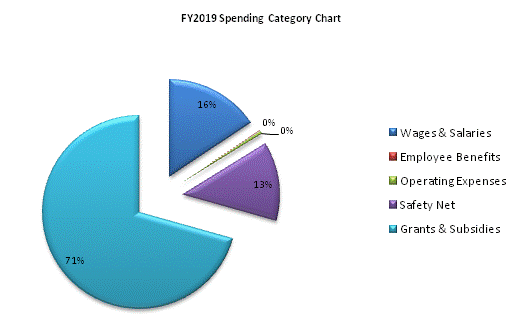
| Wages & Salaries | 1,110,835 | 1,136,134 | 1,118,361 | 1,124,890 | 1,136,231 |
| Employee Benefits | 15,332 | 15,306 | 15,614 | 6,795 | 6,904 |
| Operating Expenses | 38,785 | 36,923 | 37,153 | 32,716 | 34,171 |
| Safety Net | 843,347 | 869,334 | 865,611 | 915,728 | 957,813 |
| Grants & Subsidies | 4,687,427 | 4,817,519 | 4,902,349 | 5,023,250 | 5,135,402 |
| Other | 232 | 232 | 232 | 15,607 | 0 |
| TOTAL | 6,695,959 | 6,875,449 | 6,939,319 | 7,118,987 | 7,270,521 |

 top of page