Executive Office of Technology Services and Security
| SPENDING CATEGORY |
FY2015 Expended |
FY2016 Expended |
FY2017 Expended |
FY2018 Projected Spending |
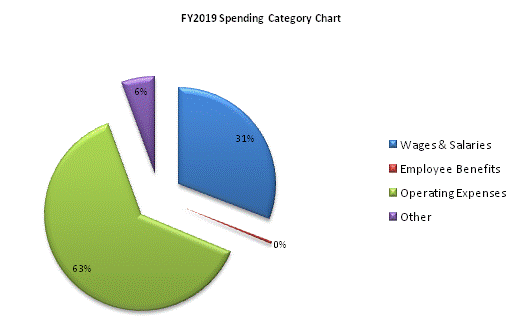
FY2019 House 2 |
|---|---|---|---|---|---|
| Wages & Salaries | 4,240 | 2,407 | 3,347 | 3,043 | 11,172 |
| Employee Benefits | 68 | 41 | 57 | 44 | 152 |
| Operating Expenses | 1,595 | 1,676 | 4,401 | 4,873 | 22,835 |
| Other | 0 | 0 | 0 | 9,374 | 2,000 |
| TOTAL | 5,903 | 4,124 | 7,805 | 17,334 | 36,160 |

 top of page