- Executive Summary
- Preamble & Section 1
- Appropriations Recommendation
- Line Item Summary
- Local Aid to Cities and Towns
- Outside Sections
- Financial Statements
- Operating Transfers
- Tax Expenditure Budget
- Downloads
Public Safety and Security
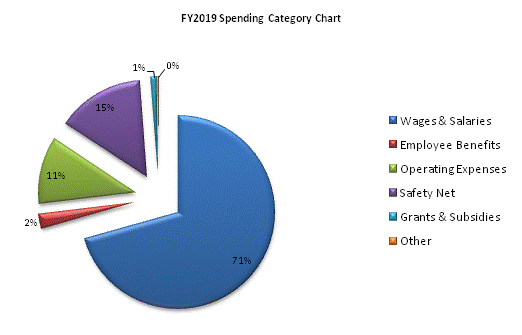
| SPENDING CATEGORY |
FY2015 Expended |
FY2016 Expended |
FY2017 Expended |
FY2018 Projected Spending |
FY2019 House 2 |
|---|---|---|---|---|---|
| Wages & Salaries | 758,084 | 765,890 | 773,371 | 772,943 | 806,422 |
| Employee Benefits | 27,212 | 28,544 | 28,902 | 28,378 | 28,498 |
| Operating Expenses | 126,985 | 126,476 | 110,170 | 127,350 | 127,332 |
| Safety Net | 108,134 | 118,668 | 128,616 | 159,353 | 166,218 |
| Grants & Subsidies | 14,074 | 20,261 | 16,953 | 13,335 | 11,321 |
| Other | 731 | 2,062 | 2,062 | 9,059 | 2,048 |
| TOTAL | 1,035,220 | 1,061,900 | 1,060,074 | 1,110,418 | 1,141,839 |

 top of page