- Executive Summary
- Preamble & Section 1
- Appropriations Recommendation
- Line Item Summary
- Local Aid to Cities and Towns
- Outside Sections
- Financial Statements
- Operating Transfers
- Tax Expenditure Budget
- Downloads
Office of the Secretary of Public Safety and Security
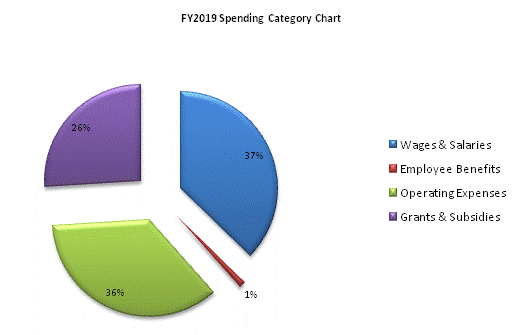
| SPENDING CATEGORY |
FY2015 Expended |
FY2016 Expended |
FY2017 Expended |
FY2018 Projected Spending |
FY2019 House 2 |
|---|---|---|---|---|---|
| Wages & Salaries | 9,160 | 9,267 | 9,764 | 8,948 | 9,137 |
| Employee Benefits | 248 | 216 | 316 | 254 | 265 |
| Operating Expenses | 14,340 | 14,457 | 13,272 | 9,987 | 8,715 |
| Safety Net | 0 | 0 | 75 | 0 | 0 |
| Grants & Subsidies | 8,287 | 9,302 | 6,696 | 6,378 | 6,364 |
| Other | 0 | 0 | 0 | 2,589 | 0 |
| TOTAL | 32,034 | 33,243 | 30,122 | 28,156 | 24,481 |
 top of page