- Executive Summary
- Preamble & Section 1
- Appropriations Recommendation
- Line Item Summary
- Local Aid to Cities and Towns
- Outside Sections
- Financial Statements
- Operating Transfers
- Tax Expenditure Budget
- Downloads
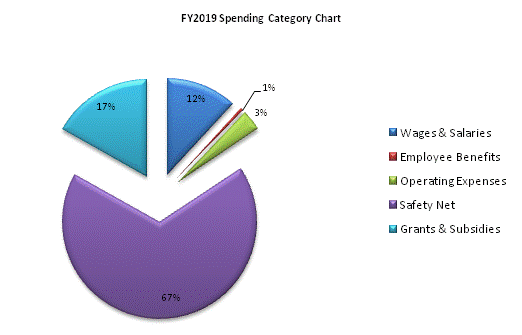
Executive Office of Housing and Economic Development
| SPENDING CATEGORY |
FY2015 Expended |
FY2016 Expended |
FY2017 Expended |
FY2018 Projected Spending |
FY2019 House 2 |
|---|---|---|---|---|---|
| Wages & Salaries | 58,957 | 56,136 | 48,449 | 60,897 | 62,063 |
| Employee Benefits | 2,138 | 2,166 | 2,051 | 2,615 | 2,622 |
| Operating Expenses | 13,286 | 12,418 | 12,913 | 16,209 | 17,731 |
| Safety Net | 337,840 | 360,746 | 353,460 | 354,378 | 353,887 |
| Grants & Subsidies | 108,300 | 108,118 | 73,242 | 82,795 | 88,495 |
| Other | 0 | 0 | 0 | 17,978 | 0 |
| TOTAL | 520,520 | 539,584 | 490,115 | 534,872 | 524,799 |

 top of page