- Executive Summary
- Preamble & Section 1
- Appropriations Recommendation
- Line Item Summary
- Local Aid to Cities and Towns
- Outside Sections
- Financial Statements
- Operating Transfers
- Tax Expenditure Budget
- Downloads
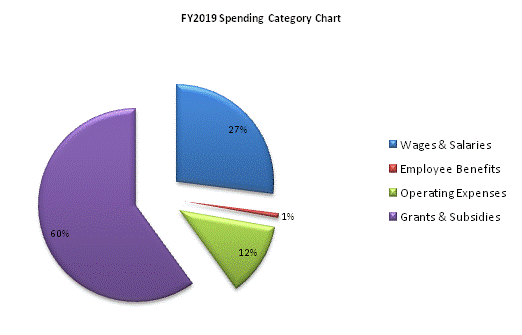
Office of the Secretary of Housing and Economic Development
| SPENDING CATEGORY |
FY2015 Expended |
FY2016 Expended |
FY2017 Expended |
FY2018 Projected Spending |
FY2019 House 2 |
|---|---|---|---|---|---|
| Wages & Salaries | 2,529 | 3,402 | 3,284 | 3,403 | 3,446 |
| Employee Benefits | 47 | 79 | 87 | 98 | 98 |
| Operating Expenses | 1,570 | 1,829 | 1,658 | 1,840 | 1,568 |
| Grants & Subsidies | 21,105 | 11,882 | 5,049 | 3,428 | 7,650 |
| Other | 0 | 0 | 0 | 3,251 | 0 |
| TOTAL | 25,251 | 17,192 | 10,079 | 12,020 | 12,762 |

 top of page