- Executive Summary
- Preamble & Section 1
- Appropriations Recommendation
- Line Item Summary
- Local Aid to Cities and Towns
- Outside Sections
- Financial Statements
- Operating Transfers
- Tax Expenditure Budget
- Downloads
Judiciary
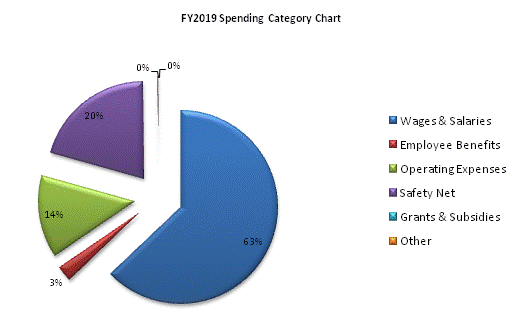
| SPENDING CATEGORY |
FY2015 Expended |
FY2016 Expended |
FY2017 Expended |
FY2018 Projected Spending |
FY2019 House 2 |
|---|---|---|---|---|---|
| Wages & Salaries | 556,006 | 569,163 | 584,693 | 584,541 | 600,888 |
| Employee Benefits | 23,553 | 24,442 | 25,488 | 24,943 | 25,180 |
| Operating Expenses | 105,515 | 121,492 | 118,671 | 131,356 | 131,855 |
| Safety Net | 161,564 | 170,784 | 186,548 | 194,139 | 195,939 |
| Grants & Subsidies | 0 | 0 | 200 | 3,280 | 839 |
| Other | 657 | 766 | 807 | 807 | 807 |
| TOTAL | 847,294 | 886,647 | 916,407 | 939,067 | 955,508 |

 top of page