- Executive Summary
- Preamble & Section 1
- Appropriations Recommendation
- Line Item Summary
- Local Aid to Cities and Towns
- Outside Sections
- Financial Statements
- Operating Transfers
- Tax Expenditure Budget
- Downloads
Trial Court
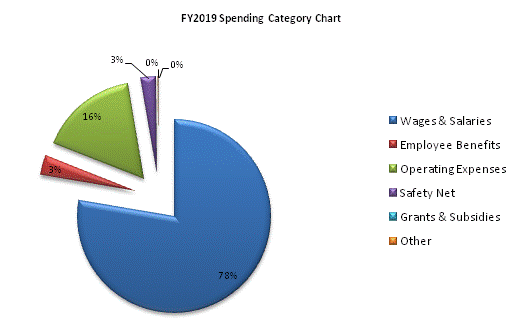
| SPENDING CATEGORY |
FY2015 Expended |
FY2016 Expended |
FY2017 Expended |
FY2018 Projected Spending |
FY2019 House 2 |
|---|---|---|---|---|---|
| Wages & Salaries | 475,363 | 484,432 | 496,296 | 504,137 | 519,266 |
| Employee Benefits | 21,500 | 22,150 | 22,901 | 21,834 | 22,122 |
| Operating Expenses | 92,018 | 106,951 | 103,690 | 109,170 | 109,466 |
| Safety Net | 11,987 | 12,025 | 12,222 | 17,414 | 16,617 |
| Grants & Subsidies | 0 | 0 | 200 | 3,250 | 250 |
| Other | 657 | 766 | 807 | 807 | 807 |
| TOTAL | 601,526 | 626,324 | 636,116 | 656,611 | 668,527 |
 top of page