- Executive Summary
- Preamble & Section 1
- Appropriations Recommendation
- Line Item Summary
- Local Aid to Cities and Towns
- Outside Sections
- Financial Statements
- Operating Transfers
- Tax Expenditure Budget
- Downloads
Supreme Judicial Court
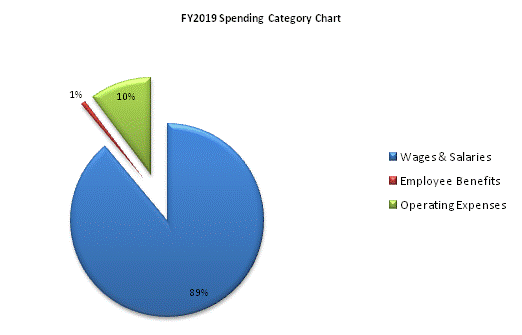
| SPENDING CATEGORY |
FY2015 Expended |
FY2016 Expended |
FY2017 Expended |
FY2018 Projected Spending |
FY2019 House 2 |
|---|---|---|---|---|---|
| Wages & Salaries | 24,076 | 26,882 | 28,194 | 28,637 | 29,161 |
| Employee Benefits | 220 | 239 | 267 | 252 | 261 |
| Operating Expenses | 3,090 | 3,106 | 3,107 | 3,178 | 3,358 |
| TOTAL | 27,386 | 30,227 | 31,568 | 32,066 | 32,780 |

 top of page