- Executive Summary
- Preamble & Section 1
- Appropriations Recommendation
- Line Item Summary
- Local Aid to Cities and Towns
- Outside Sections
- Financial Statements
- Operating Transfers
- Tax Expenditure Budget
- Downloads
Department of Fish and Game
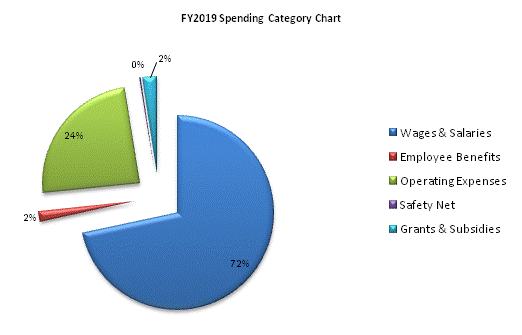
| SPENDING CATEGORY |
FY2015 Expended |
FY2016 Expended |
FY2017 Expended |
FY2018 Projected Spending |
FY2019 House 2 |
|---|---|---|---|---|---|
| Wages & Salaries | 16,783 | 18,055 | 18,507 | 20,106 | 20,354 |
| Employee Benefits | 428 | 433 | 440 | 489 | 490 |
| Operating Expenses | 7,789 | 7,604 | 5,505 | 7,837 | 6,831 |
| Safety Net | 57 | 93 | 61 | 66 | 66 |
| Grants & Subsidies | 535 | 343 | 52 | 307 | 657 |
| Other | 0 | 0 | 0 | 1,315 | 0 |
| TOTAL | 25,591 | 26,528 | 24,564 | 30,121 | 28,398 |

 top of page