- Executive Summary
- Preamble & Section 1
- Appropriations Recommendation
- Judiciary
- Independents
- District Attorneys
- Sheriffs
- Governor's Office
- Secretary of State
- Treasurer
- State Auditor
- Attorney General
- State Ethics Commission
- Inspector General
- Campaign Finance
- Comm. Against Discrimination
- Status of Women
- Disabled Persons Protection
- Library Commissioners
- Comptroller
- Office of the Child Advocate
- Cannabis Control Commission
- Mass Gaming Commission
- Center for Health Info and Analysis
- Administration and Finance
- Tech Services and Security
- Energy & Environmental Affairs
- Health and Human Services
- Transportation
- Housing & Economic Development
- Labor & Workforce Development
- Education
- Public Safety
- Legislature
- Line Item Summary
- Local Aid to Cities and Towns
- Outside Sections
- Financial Statements
- Operating Transfers
- Tax Expenditure Budget
- Downloads
Office of the Treasurer and Receiver-General
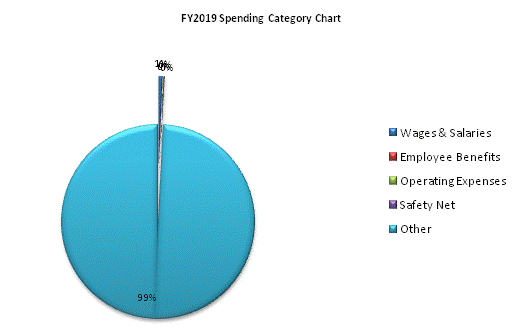
| SPENDING CATEGORY |
FY2015 Expended |
FY2016 Expended |
FY2017 Expended |
FY2018 Projected Spending |
FY2019 House 2 |
|---|---|---|---|---|---|
| Wages & Salaries | 8,209 | 9,153 | 9,347 | 9,543 | 13,005 |
| Employee Benefits | 248 | 297 | 219 | 149 | 150 |
| Operating Expenses | 4,071 | 3,522 | 3,716 | 3,963 | 4,041 |
| Safety Net | 2,120 | 1,212 | 1,790 | 3,015 | 3,015 |
| Grants & Subsidies | 60 | 65 | 60 | 0 | 0 |
| Other | 2,240,812 | 2,218,046 | 2,351,189 | 2,432,806 | 2,470,989 |
| TOTAL | 2,255,519 | 2,232,295 | 2,366,320 | 2,449,475 | 2,491,200 |
 top of page