- Executive Summary
- Preamble & Section 1
- Appropriations Recommendation
- Judiciary
- Independents
- District Attorneys
- Sheriffs
- Governor's Office
- Secretary of State
- Treasurer
- State Auditor
- Attorney General
- State Ethics Commission
- Inspector General
- Campaign Finance
- Comm. Against Discrimination
- Status of Women
- Disabled Persons Protection
- Library Commissioners
- Comptroller
- Office of the Child Advocate
- Cannabis Control Commission
- Mass Gaming Commission
- Center for Health Info and Analysis
- Administration and Finance
- Tech Services and Security
- Energy & Environmental Affairs
- Health and Human Services
- Transportation
- Housing & Economic Development
- Labor & Workforce Development
- Education
- Public Safety
- Legislature
- Line Item Summary
- Local Aid to Cities and Towns
- Outside Sections
- Financial Statements
- Operating Transfers
- Tax Expenditure Budget
- Downloads
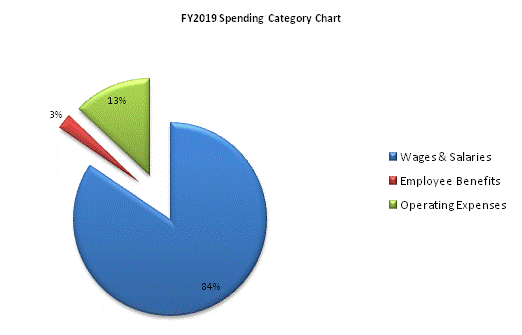
Office of the State Auditor
| SPENDING CATEGORY |
FY2015 Expended |
FY2016 Expended |
FY2017 Expended |
FY2018 Projected Spending |
FY2019 House 2 |
|---|---|---|---|---|---|
| Wages & Salaries | 14,402 | 14,939 | 15,401 | 15,829 | 15,654 |
| Employee Benefits | 466 | 484 | 487 | 477 | 477 |
| Operating Expenses | 2,908 | 2,929 | 2,341 | 2,417 | 2,400 |
| TOTAL | 17,775 | 18,352 | 18,229 | 18,723 | 18,531 |

 top of page