Quick Links
- Executive Summary
- Preamble & Section 1
-
Appropriations Recommendation
- Judiciary
-
Independents
- District Attorneys
- Sheriffs
- Governor's Office
- Secretary of State
- Treasurer
- State Auditor
- Attorney General
- State Ethics Commission
- Inspector General
- Campaign Finance
- Comm. Against Discrimination
- Status of Women
- Disabled Persons Protection
- Library Commissioners
- Comptroller
- Office of the Child Advocate
- Mass Gaming Commission
- Center for Health Info and Analysis
- Administration and Finance
- Energy & Environmental Affairs
- Health and Human Services
- Transportation
- Housing & Economic Development
- Labor & Workforce Development
- Education
- Public Safety
- Legislature
- Line Item Summary
- Local Aid to Cities and Towns
- Outside Sections
- Financial Statements
- Operating Transfers
- Tax Expenditure Budget
- Downloads
- Related Legislation
Treasurer and Receiver-General
| SPENDING CATEGORY |
FY2014
Expended |
FY2015
Expended |
FY2016
Expended |
FY2017
Projected Spending |
FY2018
House 1 |
|---|---|---|---|---|---|
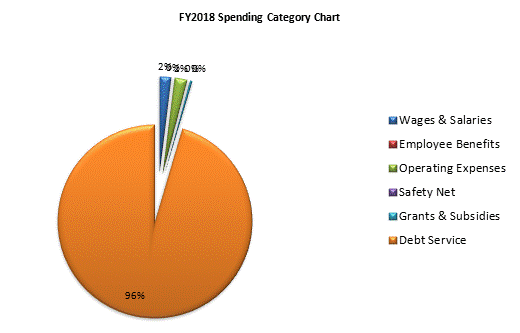
| Wages & Salaries | 45,048 | 48,691 | 51,471 | 50,191 | 49,935 |
| Employee Benefits | 1,301 | 1,615 | 1,713 | 1,696 | 1,768 |
| Operating Expenses | 56,724 | 57,357 | 56,820 | 54,158 | 55,422 |
| Safety Net | 2,263 | 2,208 | 1,277 | 3,084 | 3,081 |
| Grants & Subsidies | 5,462 | 9,093 | 10,870 | 10,836 | 10,400 |
| Debt Service | 2,225,142 | 2,302,614 | 2,275,424 | 2,506,509 | 2,532,822 |
| TOTAL | 2,335,940 | 2,421,577 | 2,397,576 | 2,626,474 | 2,653,429 |

 top of page