Quick Links
- Executive Summary
- Preamble & Section 1
-
Appropriations Recommendation
- Judiciary
-
Independents
- District Attorneys
- Sheriffs
- Governor's Office
- Secretary of State
- Treasurer
- State Auditor
- Attorney General
- State Ethics Commission
- Inspector General
- Campaign Finance
- Comm. Against Discrimination
- Status of Women
- Disabled Persons Protection
- Library Commissioners
- Comptroller
- Office of the Child Advocate
- Mass Gaming Commission
- Center for Health Info and Analysis
- Administration and Finance
- Energy & Environmental Affairs
- Health and Human Services
- Transportation
- Housing & Economic Development
- Labor & Workforce Development
- Education
- Public Safety
- Legislature
- Line Item Summary
- Local Aid to Cities and Towns
- Outside Sections
- Financial Statements
- Operating Transfers
- Tax Expenditure Budget
- Downloads
- Related Legislation
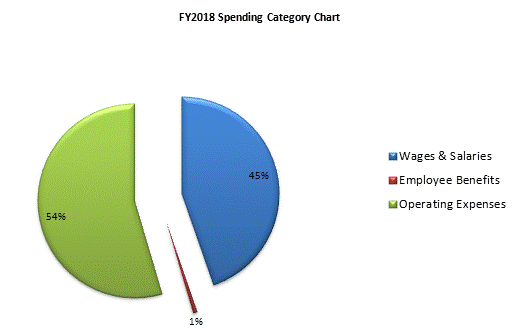
Office of the Comptroller
| SPENDING CATEGORY |
FY2014
Expended |
FY2015
Expended |
FY2016
Expended |
FY2017
Projected Spending |
FY2018
House 1 |
|---|---|---|---|---|---|
| Wages & Salaries | 11,742 | 10,687 | 11,322 | 8,313 | 8,461 |
| Employee Benefits | 6,025 | 167 | 1,453 | 2,632 | 133 |
| Operating Expenses | 146,056 | 460,624 | 87,480 | 10,580 | 10,330 |
| Safety Net | 50,000 | 0 | 0 | 0 | 0 |
| Grants & Subsidies | 29,109 | 0 | 0 | 0 | 0 |
| TOTAL | 242,931 | 471,478 | 100,254 | 21,525 | 18,923 |

 top of page