Quick Links
- Executive Summary
- Preamble & Section 1
- Appropriations Recommendation
- Line Item Summary
- Local Aid to Cities and Towns
- Outside Sections
- Financial Statements
- Operating Transfers
- Tax Expenditure Budget
- Downloads
- Related Legislation
8900-0001 - Department of Correction Facility Operations
| SPENDING CATEGORY |
FY2014
Expended |
FY2015
Expended |
FY2016
Expended |
FY2017
Projected Spending |
FY2018
House 1 |
|---|---|---|---|---|---|
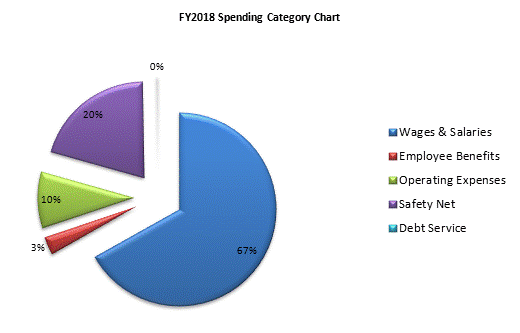
| Wages & Salaries | 379,292 | 386,603 | 384,676 | 393,787 | 417,838 |
| Employee Benefits | 15,400 | 17,304 | 17,867 | 18,754 | 18,967 |
| Operating Expenses | 59,613 | 58,401 | 57,153 | 59,201 | 59,211 |
| Safety Net | 99,635 | 103,182 | 102,449 | 123,206 | 127,206 |
| Grants & Subsidies | 2,548 | 0 | 2,668 | 2,200 | 0 |
| Debt Service | 731 | 731 | 1,725 | 1,722 | 1,722 |
| TOTAL | 557,219 | 566,221 | 566,539 | 598,869 | 624,942 |

 top of page