Quick Links
- Executive Summary
- Preamble & Section 1
- Appropriations Recommendation
- Line Item Summary
- Local Aid to Cities and Towns
- Outside Sections
- Financial Statements
- Operating Transfers
- Tax Expenditure Budget
- Downloads
- Related Legislation
7061-9408 - Targeted Assistance and Innovation
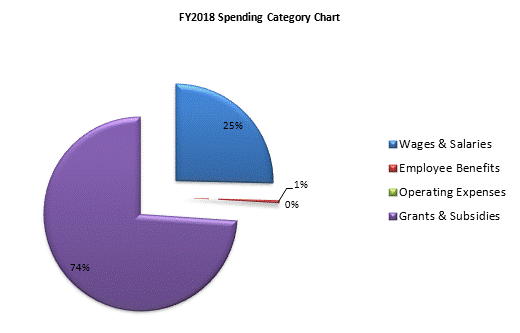
| SPENDING CATEGORY |
FY2014
Expended |
FY2015
Expended |
FY2016
Expended |
FY2017
Projected Spending |
FY2018
House 1 |
|---|---|---|---|---|---|
| Wages & Salaries | 6,187 | 6,572 | 6,319 | 5,883 | 7,095 |
| Employee Benefits | 78 | 92 | 85 | 91 | 123 |
| Operating Expenses | 10 | 10 | 9 | 11 | 69 |
| Grants & Subsidies | 1,439 | 1,567 | 1,565 | 1,776 | 20,672 |
| TOTAL | 7,713 | 8,241 | 7,977 | 7,761 | 27,958 |
 top of page