Quick Links
- Executive Summary
- Preamble & Section 1
- Appropriations Recommendation
- Line Item Summary
- Local Aid to Cities and Towns
- Outside Sections
- Financial Statements
- Operating Transfers
- Tax Expenditure Budget
- Downloads
- Related Legislation
0330-0300 - Administrative Staff
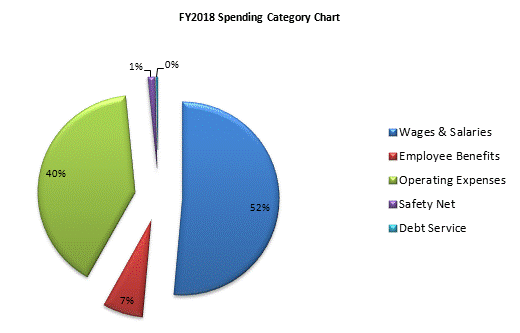
| SPENDING CATEGORY |
FY2014
Expended |
FY2015
Expended |
FY2016
Expended |
FY2017
Projected Spending |
FY2018
House 1 |
|---|---|---|---|---|---|
| Wages & Salaries | 114,022 | 112,660 | 115,071 | 120,494 | 119,906 |
| Employee Benefits | 14,267 | 15,303 | 14,679 | 15,727 | 15,776 |
| Operating Expenses | 81,449 | 81,928 | 95,884 | 91,021 | 93,869 |
| Safety Net | 3,046 | 3,059 | 2,580 | 2,895 | 2,895 |
| Debt Service | 657 | 657 | 766 | 766 | 766 |
| TOTAL | 213,441 | 213,606 | 228,980 | 230,902 | 233,211 |
 top of page