- Executive Summary
- Preamble & Section 1
- Appropriations Recommendation
- Line Item Summary
- Local Aid to Cities and Towns
- Outside Sections
- Financial Statements
- Operating Transfers
- Tax Expenditure Budget
- Downloads
Senate
| SPENDING CATEGORY |
FY2015 Expended |
FY2016 Expended |
FY2017 Expended |
FY2018 Projected Spending |
FY2019 House 2 |
|---|---|---|---|---|---|
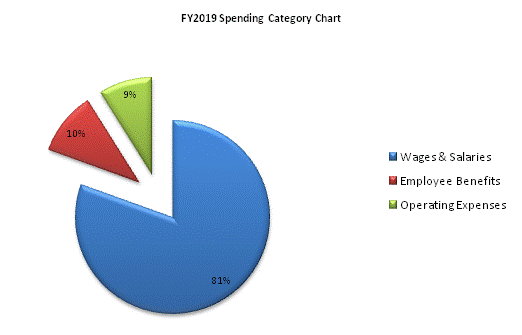
| Wages & Salaries | 16,868 | 16,965 | 17,785 | 15,858 | 15,858 |
| Employee Benefits | 366 | 363 | 347 | 2,070 | 2,070 |
| Operating Expenses | 2,894 | 525 | 398 | 1,767 | 1,767 |
| TOTAL | 20,129 | 17,854 | 18,530 | 19,695 | 19,695 |

 top of page