- Executive Summary
- Preamble & Section 1
- Appropriations Recommendation
- Line Item Summary
- Local Aid to Cities and Towns
- Outside Sections
- Financial Statements
- Operating Transfers
- Tax Expenditure Budget
- Downloads
Executive Office of Labor and Workforce Development
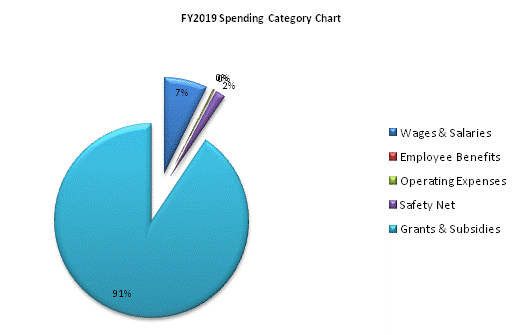
| SPENDING CATEGORY |
FY2015 Expended |
FY2016 Expended |
FY2017 Expended |
FY2018 Projected Spending |
FY2019 House 2 |
|---|---|---|---|---|---|
| Wages & Salaries | 752 | 732 | 677 | 650 | 657 |
| Employee Benefits | 12 | 12 | 12 | 16 | 16 |
| Operating Expenses | 9 | 5 | 31 | 21 | 21 |
| Safety Net | 0 | 0 | 0 | 0 | 152 |
| Grants & Subsidies | 3,871 | 6,200 | 4,163 | 4,876 | 8,174 |
| Other | 0 | 0 | 0 | 760 | 0 |
| TOTAL | 4,644 | 6,950 | 4,883 | 6,323 | 9,019 |

 top of page