- Executive Summary
- Preamble & Section 1
- Appropriations Recommendation
- Line Item Summary
- Local Aid to Cities and Towns
- Outside Sections
- Financial Statements
- Operating Transfers
- Tax Expenditure Budget
- Downloads
8900-0001 - Department of Correction Facility Operations
| SPENDING CATEGORY |
FY2015 Expended |
FY2016 Expended |
FY2017 Expended |
FY2018 Projected Spending |
FY2019 House 2 |
|---|---|---|---|---|---|
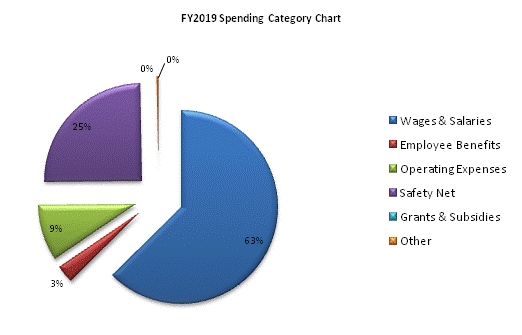
| Wages & Salaries | 386,603 | 384,676 | 392,772 | 397,604 | 394,772 |
| Employee Benefits | 17,304 | 17,867 | 18,388 | 18,671 | 18,659 |
| Operating Expenses | 58,401 | 57,153 | 52,854 | 58,637 | 58,782 |
| Safety Net | 103,182 | 102,449 | 123,289 | 145,524 | 156,749 |
| Grants & Subsidies | 0 | 2,668 | 2,200 | 2,290 | 90 |
| Other | 731 | 1,725 | 1,725 | 1,985 | 1,725 |
| TOTAL | 566,221 | 566,539 | 591,228 | 624,710 | 630,776 |

 top of page