- Executive Summary
- Preamble & Section 1
- Appropriations Recommendation
- Line Item Summary
- Local Aid to Cities and Towns
- Outside Sections
- Financial Statements
- Operating Transfers
- Tax Expenditure Budget
- Downloads
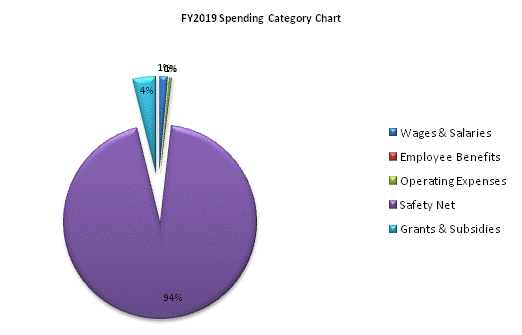
2511-0105 - Emergency Food Assistance
| SPENDING CATEGORY |
FY2015 Expended |
FY2016 Expended |
FY2017 Expended |
FY2018 Projected Spending |
FY2019 House 2 |
|---|---|---|---|---|---|
| Wages & Salaries | 184 | 224 | 230 | 235 | 235 |
| Employee Benefits | 4 | 5 | 6 | 6 | 6 |
| Operating Expenses | 92 | 91 | 84 | 78 | 79 |
| Safety Net | 14,705 | 16,680 | 16,680 | 16,680 | 16,680 |
| Grants & Subsidies | 50 | 160 | 0 | 0 | 674 |
| Other | 0 | 0 | 0 | 675 | 0 |
| TOTAL | 15,035 | 17,160 | 17,000 | 17,674 | 17,674 |

 top of page