Quick Links
- Executive Summary
- Preamble & Section 1
- Appropriations Recommendation
- Line Item Summary
- Local Aid to Cities and Towns
- Outside Sections
- Financial Statements
- Operating Transfers
- Tax Expenditure Budget
- Downloads
- Related Legislation
3000-1020 - Quality Improvement
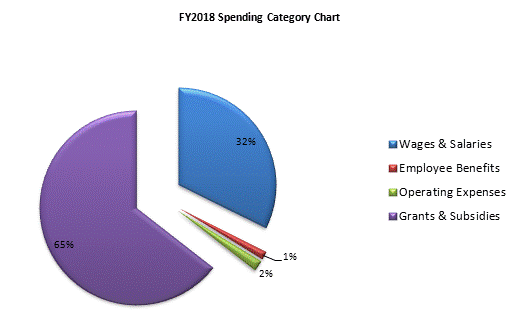
| SPENDING CATEGORY |
FY2014
Expended |
FY2015
Expended |
FY2016
Expended |
FY2017
Projected Spending |
FY2018
House 1 |
|---|---|---|---|---|---|
| Wages & Salaries | 0 | 0 | 0 | 8,736 | 10,337 |
| Employee Benefits | 0 | 0 | 0 | 439 | 439 |
| Operating Expenses | 0 | 0 | 0 | 577 | 577 |
| Grants & Subsidies | 0 | 0 | 0 | 21,985 | 20,610 |
| TOTAL | 0 | 0 | 0 | 31,738 | 31,962 |
 top of page