Quick Links
- Executive Summary
- Preamble & Section 1
- Appropriations Recommendations
- Judiciary
- Independents
- Administration and Finance
- Energy & Environmental Affairs
- Health and Human Services
- Health & Human Services
- Elder Affairs
- Public Health
- Mental Health
- Refugees and Immigrants
- Youth Services
- Transitional Assistance
- Children and Families
- Mass Commission for the Blind
- Mass Rehabilitation Commission
- Mass Commission for the Deaf
- Soldiers' Home, Chelsea
- Soldiers' Home, Holyoke
- Developmental Services
- Veterans' Services
- Transportation
- Housing & Economic Development
- Labor & Workforce Development
- Education
- Public Safety
- Legislature
- Line Item Summary
- Local Aid to Cities and Towns
- Outside Sections
- Financial Statements
- Operating Transfers
- Tax Expenditure Budget
- Downloads
- Related Legislation
Executive Office of Health and Human Services
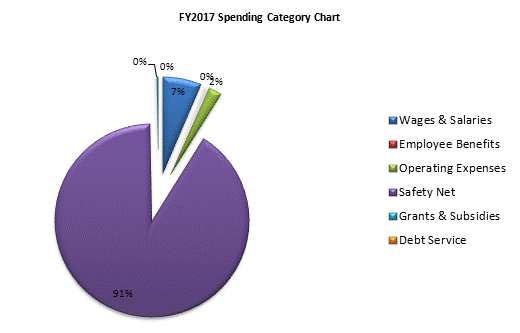
| SPENDING CATEGORY |
FY2013 Expended |
FY2014 Expended |
FY2015 Expended |
FY2016 Projected Spending * |
FY2017 House 2 |
|---|---|---|---|---|---|
| Wages & Salaries | 1,157,462 | 1,204,791 | 1,272,297 | 1,293,284 | 1,388,696 |
| Employee Benefits | 42,372 | 45,945 | 52,080 | 52,631 | 57,325 |
| Operating Expenses | 370,304 | 412,385 | 526,003 | 472,909 | 492,545 |
| Safety Net | 14,586,534 | 15,685,829 | 17,355,668 | 19,801,481 | 19,892,707 |
| Grants & Subsidies | 31,516 | 78,881 | 36,132 | 64,625 | 63,365 |
| Debt Service | 0 | 367 | 1,892 | 1,892 | 1,892 |
| TOTAL | 16,188,188 | 17,428,198 | 19,244,072 | 21,686,823 | 21,896,530 |

 top of page