Quick Links
- Executive Summary
- Preamble & Section 1
- Appropriations Recommendations
- Line Item Summary
- Local Aid to Cities and Towns
- Outside Sections
- Financial Statements
- Operating Transfers
- Tax Expenditure Budget
- Downloads
- Related Legislation
Executive Office of Education
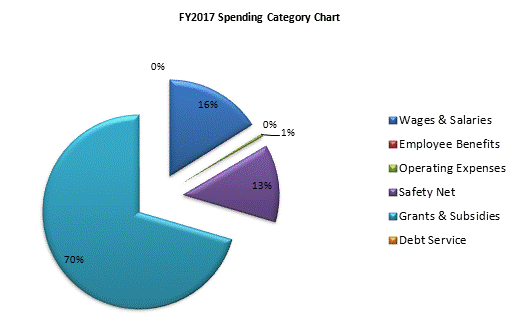
| SPENDING CATEGORY |
FY2013 Expended |
FY2014 Expended |
FY2015 Expended |
FY2016 Projected Spending * |
FY2017 House 2 |
|---|---|---|---|---|---|
| Wages & Salaries | 937,979 | 1,031,083 | 1,110,835 | 1,124,041 | 1,115,152 |
| Employee Benefits | 12,268 | 13,773 | 15,332 | 7,040 | 6,984 |
| Operating Expenses | 26,516 | 30,687 | 38,785 | 36,659 | 32,886 |
| Safety Net | 773,485 | 809,736 | 843,347 | 882,122 | 898,421 |
| Grants & Subsidies | 4,461,786 | 4,625,776 | 4,687,427 | 4,831,546 | 4,901,595 |
| Debt Service | 0 | 0 | 232 | 17,140 | 479 |
| TOTAL | 6,212,034 | 6,511,055 | 6,695,959 | 6,898,550 | 6,955,518 |

 top of page